
Direktlänk till inlägg 26 januari 2022
VEARS SUMMERY 14/1-2022
All charts and tables below reflect the data release on 01/21/2022 from the VAERS website, which includes U.S and foreign data, and is updated through: 1/14/2022
| High-Level Summary | COVID19 vaccines (Dec’2020 – present) | All other vaccines 1990-present | US Data Only COVID19 vaccines (Dec’2020 – present) | US Data Only All other vaccines 1990-present |
|---|---|---|---|---|
| Number of Adverse Reactions | 1,053,830 | 868,339 | 732,883 | 755,841 |
| Number of Life-Threatening Events | 25,265 | 14,333 | 11,397 | 9,911 |
| Number of Hospitalizations | 118,684 | 82,900 | 49,167 | 38,827 |
| Number of Deaths | 22,193* | 9,478* | 10,162 | 5,254 |
| # of Permanent Disabilities after vaccination | 39,150 | 20,742 | 11,861 | 12,829 |
| Number of Office Visits | 164,278 | 49,430 | 143,588 | 47,303 |
| # of Emergency Room/Department Visits | 113,729 | 212,476 | 91,089 | 202,974 |
| # of Birth Defects after vaccination | 835 | 191 | 451 | 104 |
*Note that the total number of deaths associated with the COVID-19 vaccines is more than double the number of deaths associated with all other vaccines combined since the year 1990.
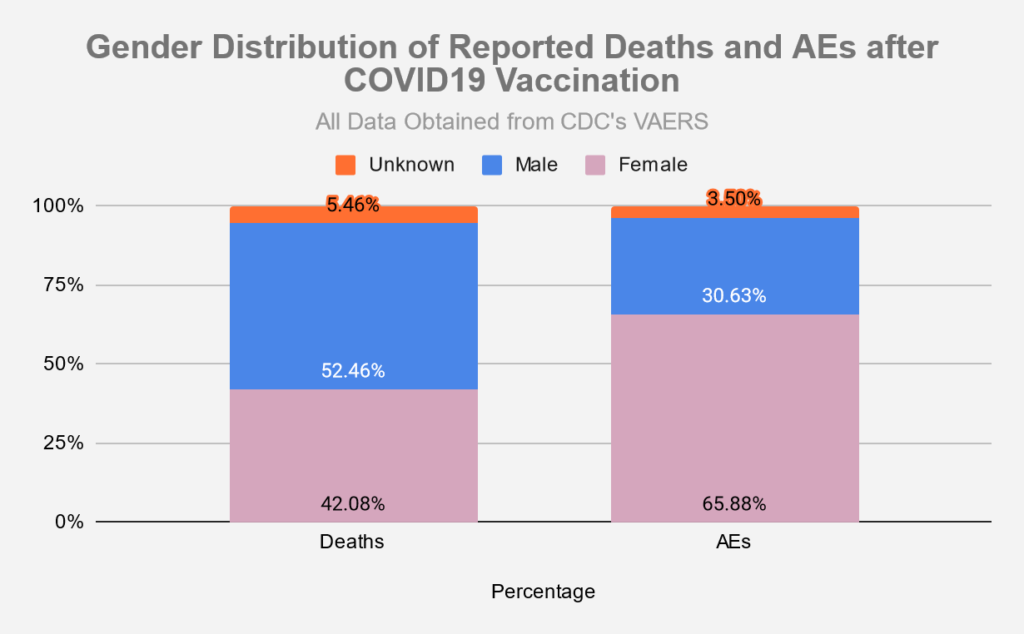
Deaths
 [Unknowns separated from All Other Vaccines for greater clarity; in a majority of cases the Unknowns are actually Covid-19]


Adverse Events
 [Unknowns separated from All Other Vaccines for greater clarity; in many cases the Unknowns are actually Covid-19]


Symptoms
The slide below was taken from an FDA document from October 22, 2020 and provides a list of possible adverse event outcomes related to the Covid-19 vaccines.
- Source: ‘Vaccines and Related Biological Products Advisory Committee October 22,2020 Meeting Presentation”.

The following table lists the number of adverse events found in the VAERS data which match the outcomes listed above:
| FDA Listed Symptom | Total (Non-Lethal) Adverse Events | Total Deaths |
|---|---|---|
| Guillain-Barre | 2114 | 36 |
| Acute Disseminated Encephalomyelitis | 155 | 5 |
| Transverse Myelitis | 379 | 3 |
| Encephalitis | 1775 | 182 |
| Convulsions/Seizures | 13303 | 394 |
| Stroke | 12628 | 1157 |
| Narcolepsy, Cataplexy | 254 | 5 |
| Anaphylaxis | 44302 | 165 |
| Acute Myocardial Infarction (Heart Attack) | 3801 | 1134 |
| Myocarditis/Pericarditis | 16301 | 188 |
| Autoimmune Disease | 1261 | 24 |
| Other Acute Demyelinating Diseases | 290 | 4 |
| Pregnancy and birth outcomes (Miscarriages) | 3486 | 108 |
| Other Allergic Reactions | 1973 | 3 |
| Thrombocytopenia | 4580 | 337 |
| Disseminated Intravascular Coagulation | 195 | 61 |
| Venous Thromboembolism | 19665 | 1124 |
| Arthritis and Arthralgia/Joint Pain | 68496 | 201 |
| Kawasaki Disease | 67 | 1 |
| Systemic Inflammatory Response Syndrome | 646 | 47 |
Vaccination Related Risks of COVID19 Vs. Flu
These set of figures compare the COVID19 vaccine to the traditional Flu vaccines. ‘Risk of Death’ percentages depend on the ‘# of Vaccinations’ data, which is only approximate, and was pulled from the CDC’s report on Flu vaccination coverage for the 2019-2020 season, and from Our World in Data for the COVID19 vaccinations.
Covid19 vaccinations through 5/31/2021 vs. Flu vaccinations 7/1/2019 – 5/31/2020 (last complete flu season)
| Vaccine Type | # of Vaccinations[3] | # of Deaths | Risk of Death | Percentage | Deaths/Mill. Vaccinations[3] |
|---|---|---|---|---|---|
| Flu | 167,447,642[1] | 33 | 1 in 5,074,171 | 0.000020% | .20 |
| COVID19 | 167,733,972[2] | 5,648 | 1 in 29,698 | 0.003367% | 33.67 |
Risk of dying from COVID vaccine is 171 times greater than Flu Vaccine
| Vaccine Type | # of Vaccinations[3] | # of Adverse Reactions | Risk of Adverse Reaction | Percentage | AEs/Mill. Vaccinations[3] |
|---|---|---|---|---|---|
| Flu | 167,447,642 | 9,716 | 1 in 17,234 | 0.005802% | 58.02 |
| COVID19 | 167,733,972 | 544,211 | 1 in 308 | 0.3244% | 3,244 |
Risk of adverse reaction from COVID vaccine is 56 times greater than Flu Vaccine
[1] number of flu vaccinations based on estimated flu vaccine coverage data from CDC and estimated population data from US Census. Yearly flu vaccination data covers a period of time from 7/1 to 5/31 of the following year.
[2] number of covid19 vaccinations based on estimates from Our World in Data [2] number of covid19 vaccinations based on estimates from Our World in Data
[3] Persons vaccinated with at least one dose.

Vaccine Data by Manufacturer
| Manufacturer | # of Deaths | % Deaths | Average Deaths/Day | # US Deaths | US Doses Administered | Average US Deaths/Mill. Doses | Days since EUA approval | EUA Approval Date- |
|---|---|---|---|---|---|---|---|---|
| Janssen (JNJ) | 1978 | 8.9% | 6.14 | 1286 | 18,065,529 | 71.19 | 322 | 2/26/2021 |
| Moderna | 5438 | 24.48% | 13.87 | 4207 | 202,127,731 | 20.81 | 392 | 12/18/2020 |
| Pfizer/Biontech | 14708 | 66.2% | 36.86 | 4641 | 311,207,242 | 14.91 | 399 | 12/11/2020 |
| Unknown | 93 | 0.42% | 41 | 464,369 |
| Manufacturer | # of AEs | % AEs | Average AEs/Day | # US AEs | US Doses Administered | Average US AEs/Mill. Doses | Days since EUA approval | EUA Approval Date |
|---|---|---|---|---|---|---|---|---|
| Janssen (JNJ) | 77028 | 7.3% | 239.22 | 65125 | 18,065,529 | 3604.93 | 322 | 2/26/2021 |
| Moderna | 383140 | 36.29% | 977.4 | 336228 | 202,127,731 | 1663.44 | 392 | 12/18/2020 |
| Pfizer/Biontech | 593066 | 56.17% | 1486.38 | 331247 | 311,207,242 | 1064.39 | 399 | 12/11/2020 |
| Unknown | 2642 | 0.25% | 1644 | 464,369 |
Vaccine Data by Gender
Vaccine Data by Location


Recall History
Sources
- Vaccine data (Covid-19 and other vaccines) taken from CDC’s VAERS website, located here: https://vaers.hhs.gov/data/datasets.html. VAERS data sets in the form of csv files are pulled down weekly and put into a database for reporting/analysis. Data files are available all the way back to 1990.
- Number of doses distributed for other vaccines found in NVICP Data and Statistics report here: https://www.hrsa.gov/sites/default/files/hrsa/vaccine-compensation/data/data-statistics-report.pdf
- Numbers for Covid-19 vaccines administered by manufacturer found here: https://covid.cdc.gov/covid-data-tracker/#vaccinations_vacc-total-admin-rate-total
- Numbers for total Covid-19 vaccine doses administered found here: https://data.cdc.gov/Vaccinations/COVID-19-Vaccination-Trends-in-the-United-States-N/rh2h-3yt2
- Numbers for Flu vaccine doses administered for 2019-2020 season found here: https://www.cdc.gov/flu/fluvaxview/coverage-1920estimates.htm
- Numbers for FDA regulated drugs taken from FDA’s FAERS website, located here: https://www.fda.gov/drugs/questions-and-answers-fdas-adverse-event-reporting-system-faers/fda-adverse-event-reporting-system-faers-public-dashboard
Post navigation
Ett års jubileum i 5d-portalen där jag har varit medlem under ett år.En bit in i klippet, cirka 54 minuter, delar jag mina erfarenheter. ...
Håkan Berggren beskriver om bl a programmering:
Från en elbolagskund: SMARTA ELMÄTARE, ETT KRAV FRÅN ENERGIMARKNADSINSPEKTIONEN OCH ETT TVÅNG FÖR ALLMÄNHETEN. Från och med en 1/1 2025, skall alla svenska hushåll vara försedda med de s k ”smarta elmätarna”. Detta är ett direktiv fr...
Presentation
Fråga mig
Kalender
| Må | Ti | On | To | Fr | Lö | Sö | |||
1 |
2 | ||||||||
3 |
4 | 5 | 6 | 7 | 8 | 9 | |||
| 10 | 11 | 12 | 13 | 14 | 15 | 16 | |||
| 17 | 18 | 19 | 20 | 21 | 22 | 23 | |||
| 24 | 25 | 26 | 27 | 28 | 29 | 30 | |||
| 31 | |||||||||
| |||||||||
Tidigare år
- För fyra år sedan
- DR SIMONE GOLD BERÄTTAR
- ÖYSTEIN RÖNNE "KAVLA NER"
- LÄKARDIREKTÖR AFLDS, SHELLEY COLE, OCH TIO FAKTAPUNKTER.
- DR SHERRI TENPENNY OM MÄRKLIGA BLÖDNINGAR.
- TRE ÄMNEN SOM INNE HÅLLER SHIKIMIC
- RAPPORT FRÅN LÄKEMEDELSVERKET, 21/5
- SPIKPROTEIN BAKOMLIGGANDE ORSAK TILL ALLVARLIGA HÄLSOTILLSTÅ...
- VILKA FÖRETAG STÅR BAKOM "KAVLA UPP"
- "FÖRLÅT DEM, TY DE VET ICKE VAD DE GÖR....."
- TIO ORSKAR TILL VARFÖR MAN KAN AVSTÅ.
- HÄLSOPANELEN MED GÄSTER 5/5,
- SHERRI TENPENNY OM ÖVERFÖRING
- TUCKER CARLSSON, TODAY
- VIRAL MISSUPPFATTNING
- För 13 år sedan
Sök i bloggen
Senaste inläggen
- 1-ÅRSJUBILEUM I 5D-PORTALEN
- 5D COACHING OM SYSTEMET
- HÅKAN BERGMARK INTEVJUAR MONA NILSSON FRÅN STRÅLSKYDDSSTIFTE...
- SMARTA ELMÄTARE, MARTIN STENSÖ RINGER IMY
- SMARTA ELMÄTARE
- TUCKER CARLSON, ÖKNING AV TURBOCANCER.......
- ZARAH öBERG TALAR MED ISILIA HOLMÖY OM EMOTION CODE OCH BODY...
- LUNCHKLUBBEN SAMMANFATTAR OM GIFTER KRING VINDKRAFTINDUSTRIN
- PETRAS PUCKAR NR 3
- ÖVERLÄKAREN, PELLE LINDQVIST, TALAR OM SOLNING
- CHANGE YOUR HANDWRITING, CHANGE YOUR LIFE, VIMALA RODGERS
- FOLKETS RADIO, MED MONA NILSSON
- FULLMÅNEMEDITATION
- LÄKNING MED 432 OCH 528 HZ
- ALFA-VÅGOR LÄKER KROPPENS INRE ORGAN
Kategorier
- Allmänt (1 489)
- 2012, UPPVAKNANDET (14)
- AFFIRMATION (3)
- AMALGAM OCH KVICKSILVER (2)
- AMEGA (20)
- ANDLIGHET (8)
- ART NEURO (3)
- BARN (13)
- BARNBARN (37)
- BEHANDLINGAR (1)
- Bengt Ingerstam och konsumenter i samverkan (2)
- BILDER (59)
- BLOOGFRÅGOR (3)
- BOKTIPS (0)
- Carl Johan Calleman (3)
- CHAGA (13)
- CHEMTRAILS (49)
- DETOX (1)
- DIKTER OCH CITAT (89)
- DJUREN (47)
- Drömmar (1)
- EGEN FILM (1)
- ENDOCANNABIONIDER OCH THC-FRI CANNABISOLJA (1)
- EVENEMANG (5)
- EVENEMANG/UPPTRÄDANDEN (4)
- FAMILJ (14)
- FILM (0)
- FILMER (4)
- FORSKNING (20)
- FÖSÄKRINGSKASSAN (4)
- GUDOMLIGA LAGAR (2)
- GUNNAR LINDGREN (3)
- HANDARBETE (104)
- HISTORIA OCH SAMHÄLLE (4)
- HUMOR (13)
- HÄLSOSAMT & HANDGJORT (78)
- HÄLSOTIPS (77)
- HÖGTIDER (31)
- INDRA (14)
- INSÄNDARE (8)
- Johan Calleman (0)
- KATTERNA (19)
- KOLLOIDALT SIVLER (1)
- KOMPLEMENTÄR MEDICIN (1)
- KOMPLEMENTÄRMEDICIN MM (47)
- LEVNADSÖDEN (6)
- LÅGENERGILAMPAN (1)
- MANTRA (3)
- Marknader (39)
- MATFETT (5)
- MEDITATION, HEALING (36)
- MIND CONTROL (1)
- MUSIK (114)
- MUSIK 432 HZ (2)
- NATURBILDER (106)
- NIENKE (30)
- ORGONIT (2)
- ORÄTTVISOR (28)
- PUBLICERAT I MASSMEDIA (31)
- RECEPT (14)
- REFLEKTIONER (180)
- RENOVERING (4)
- SANNA EHDIN (2)
- SMÖRUPPRORET (7)
- STRÅLNING (5)
- STRÅLNING, KALLE HELLBERG (4)
- SYSSELSÄTTNINGSTIPS (2)
- THE LAW OF ATTRACTION - ATTRAKTIONSLAGEN (3)
- TILLSATSER OCH GIFTER I FÖDA (1)
- TORPET (13)
- UNGDOMAR (3)
- vaccin (3)
- VALPEN, AMBER (31)
- VINSTINTRESSEN (20)
- VINTAGE (1)
- YOGA, BASTU (13)
- ZERVITAL, SVAMPANGREPP (45)
- ÅTERBRUK (2)
- ÄNGLAR (11)